Using Drindal to manage your tasks
Mostly Drindal is pretty self explanatory when you understand the process described in the overview, especially if you've used other task management tools, but a few things are unique to Drindal and could use some explaining.
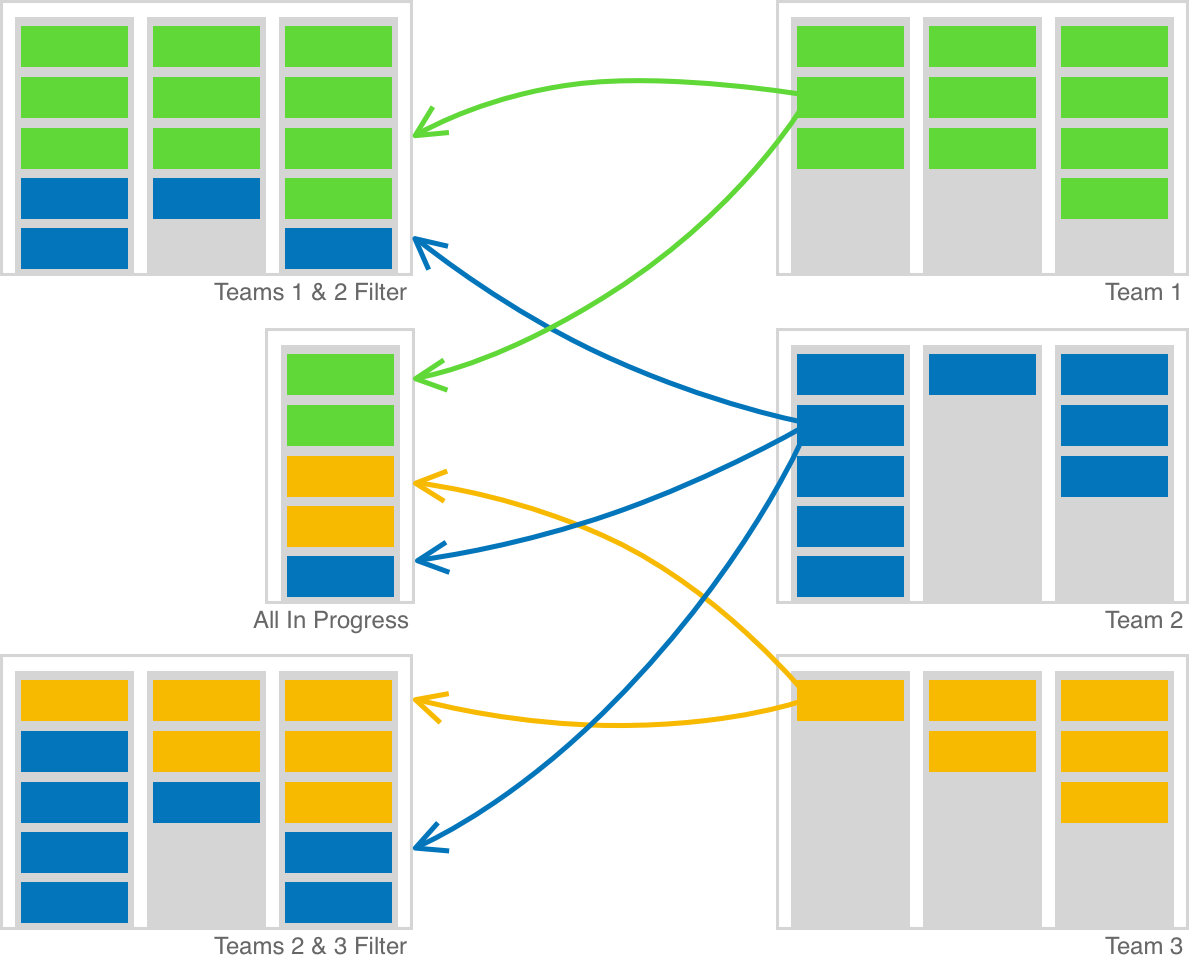
One Board, Many Filters
The Board is the main view in Drindal. It shows tasks for a selected Filter. You create Filters to specify which tasks you want to see, based on choices like team, users, tags, keywords, etc.. You use saved filters to navigate your tasks by clicking on them in the navigation. Clicking a filter link is filtering which tasks you see and how you see them.
Drindal is unique in that all the tasks across all the teams you have access to are effectively available to be shown in the board at any time, all together or in any combination you like. The filter is the key to decide what you see and how to see it.
Create a Filter
Filters are created by viewing the details of an existing filter, making changes, including giving it a new name and then clicking the "Save As" button to create a new filter instead of updating the existing one.
Views
Choose how a filter should visually display tasks by choosing a view for the filter.
Swim Lanes
Tasks are grouped into vertical "swim lanes" for each section. The sections, or lanes, are displayed across the view in the order they are defined on their team. Tasks are ordered in each lane by priority with highest priority tasks at the top. In this view, tasks progress from left to right through the lanes until they get to the "Done" lane furthest to the right.
Calendar
Tasks are shown on a calendar so you can see them by date getting an idea of when things start or are due and how they overlap each other in time.
Comments
A history of the comments, in chronological order, for all the tasks matching the filter.
Table
Tasks are listed out in expanding tables, one table per section. You can define the columns to show.
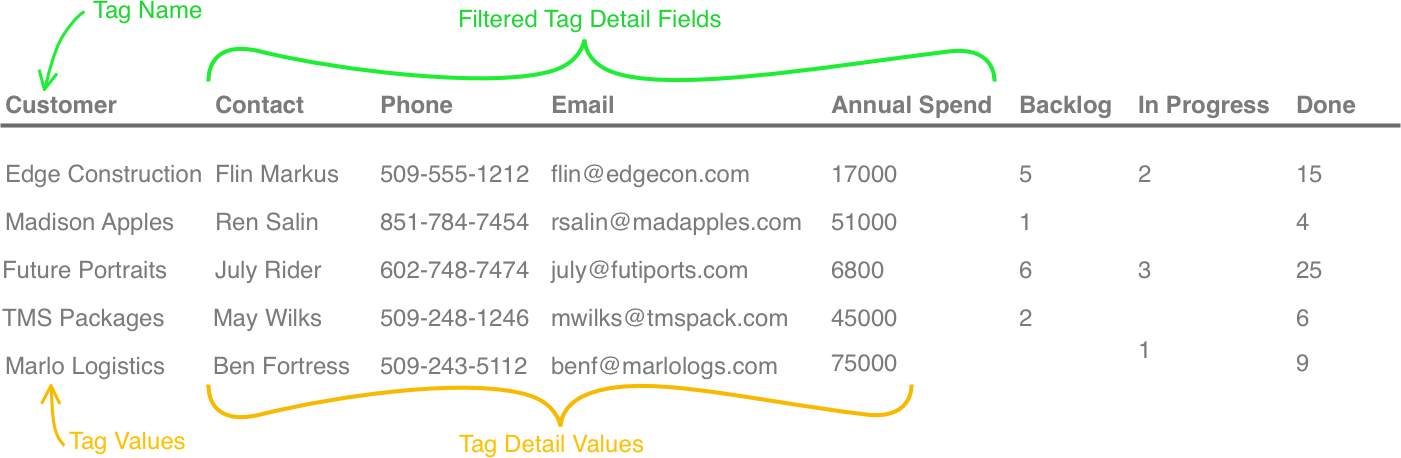
Tag Value Details
Rather than showing the tasks, this view shows the tag value details across all the tasks for the tags specified in the filter. Let's say you have a "Customer" tag and you have set it up with fields like "Contact", "Phone", "Email", "Address" and "Annual Spend". If you add a Customer tag to the filter, this view would show a table with a column for each of the fields setup for the Customer tag. The values in the columns would be the values for each customer but only for the customers assigned to tasks matching the filter. There will also be an aggregate count for each of the sections showing how many tasks were assigned to that section for each customer.
You can use specific fields in the filter to only show those fields in the table. Perhaps you add Customer.Contact and Customer.Email to the filter but not just Customer alone. Then you would see the customer value (the value of the tag, probably the customer name) and only the contact and email columns from the customer details.
If you specify multiple tags that have fields and details associated with them, you'll get a table for each tag.
Timeline
Similar to Calendar but the days of the month only run in columns from left to right in a continuous timeline for the month. Kind of like a Gant chart, this view lets you see where tasks are scheduled and how they overlap.
Route
Tasks are shown in a single column, in the optimal order they would be visited if you drove a route to visit them. You specify the fields to use as locations in the filter, using a comma delimited list.
For example, I could have a bunch of tasks for visiting customers. Those tasks would be tagged with a Customer tag and the Customer fields would have an address field where the details for each customer would have the customer's address. This address field is a single line address like "123 Main St, Boston, MA 02115". I would choose the Route view on my filter and then specify Customer.Address for the location. All the tasks will be shown in the order I'd drive to visit them so I can just go one by one down the list visiting, commenting, closing.
Continuing on this example, if I also wanted to add my personal errands to the route, I could do the same with personal tasks that have a Location tag where Location is places I regularly visit like the grocery store, school, etc. each of those values having details that include an address field (or whatever I want to name the field). Then I could specify both tag fields for addresses to be considered in the route using "Customer.Address,Location.Address". Now any tasks with either of those tags will be added to the route.
Tags & Custom Fields
In Drindal, tags and custom fields are one in the same. They are data you set on a task defined by you and we refer to them all as Tags. Tags are a name and value pair but you don't have to provide a value. For example:
Name only tags
- Critical
- Bug
- Feature
- Kids
- Summer Trip
Name & value tags
- Size: M
- Customer: Joe's Gravel
- Annual Revenue: 1,200,000
- Feature: Super Button
- Status: Open
Do More With Tags
Tag Details
When setting a tag on a task, you can click the gear icon to define a set of fields on the tag. Values for the fields are then provided for each unique value of the tag, allowing you to drill down into the tag value for more information about that value. For example:
We have a "Customer" tag and we further setup it's details with the following fields:
- Contact
- Phone
- Address
- Annual Spend
Now we add the "Customer" tag to a task with the value being a customer name, "Madison Apples". When we view the task, we'll see an info icon next to the customer name and if we click it we'll get a dialog showing us a form with the tag's fields in it where we can enter values for the fields.
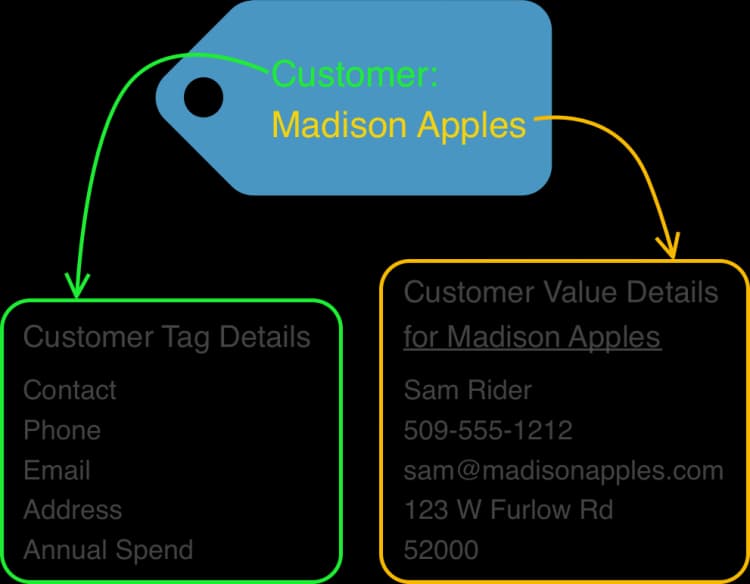
In this example we can tie tasks to our customers using the Customer tag and on any task we can simply click the info button next to the customer to see customer details.
We can also create a filter with the Tag Value Details view to show the details for all the values of a given tag. In this example, we'd have a filter that would show us all the values of the Customer tag and the associated details. Effectively, we get a table of customer details for any tasks and customers matching our filter.
Dashboards
Use dashboards to visualize and analyze data from your tasks and projects. Create a new dashboard and then add charts to it. Dashboards are assigned to a team, but a single dashboard can show information about the tasks across multiple teams as long as the user has access to those teams.
In the team details, you add charts. In the settings for each chart, you can specify the rows and columns the chart occupies. The dashboard will lay out the charts in a grid according to the rows and columns they occupy. You can drag the charts in the list of charts in the dashboard settings to reorder them.
A chart has quite a few options you can configure. Most of them are self explanatory but we'll cover a few here.
| Field | Description |
|---|---|
| rows & columns | The number of rows and columns this chart should occupy on the dashboard. |
| Sections As Transitions | When checked, tasks will be counted when they transition into the sections selected in the filter. So, if you wanted to chart how many tasks were completed each day, you would add the "Done" section to the the filter and check this box. When this box is unchecked, you're counting tasks that are in the sections selected in the filter, at any given time. So, a period on the chart would show all finished tasks in that period, no matter when they became finished, answering questions like how many tasks are in progress over time or how many finished tasks exist. |
| Facet Limit | The max number of facets to show. The facet dimension is chosen in the aggregation section. If this field is 5 and the chart is faceting on the Customer tag, at most the top 5 customers will be represented in the chart. |
| Marker | A horizontal marker line will be put across the chart at the Y value specified in the Marker field. |
| Render Area | Check this to make a line chart render as an area chart. |
| Filter fields | Use these fields just like a regular task filter on the task board to filter which tasks are included in the chart. |
| Method | How to aggregate the data. Sum, Average, Min, Max, etc. |
| Metric | The thing being aggregated. For example:
|
| Facet | What to group aggregations on. For example:
|
| Time Resolution | The amount of time to aggregate into a single number. 24 hours means aggregate into daily numbers, like in the average daily task count per user. |
| Divisor | Divide the metric values by this number. Use this when the numbers would otherwise be too large, like if a monetary tag value was in thousands but you want to show the chart data in millions, you would put 1000 here. |
Workflows
You can use workflows to automate tasks in Drindal.
Triggers
A workflow starts with a trigger. This is the event that makes the workflow happen. It can be things like a new task being created or an existing task being updated or deleted.
Filters
When a trigger event happens, a filter is compared to that event to more specifically see if the workflow applies. For example, you want a workflow to happen when a new task is created having a "New Customer" tag or when an existing task is moved from the "In Progress" section to the "Done" section.
Depending on the trigger, there could be more than one filter. For example, if the trigger is creation of a new task there will only be a single filer to test if the new task matches, but if the trigger was a task update, there would be a trigger for the old version of the task and another filter for the new version of the task so you can more precisely match against the change that actually happened.
Actions
The actions are what the workflow actually does once the trigger happens and the filters match.
For example, when a new task is created you may want to create a set of other tasks. Maybe you create a new task to add a new customer into your product and adding a new customer always involves doing 3 other things: Scheduling the welcome lunch, completing the document signing and sending the welcome packet. You could create a workflow so when the new customer task is created by a team member, it will trigger the workflow which will automatically create the other three tasks as dependencies.
Workflow Templates
A workflow action can access values from prior steps in the workflow using templates. For example, if your workflow creates two new tasks, the second task can have a dependency on the first, which has a dependency on the trigger task. Both tasks could be assigned to the same person as the trigger task and the name of the new tasks could contain the value of the customer tag in the trigger task.
The Workflow Tail
The tail is a list of "things" that are the result of the triggers or actions in a workflow. What those "things" are depends on the trigger or action they are associated with. Take a workflow with a task update trigger that is kicked off when a task moves from "In Progress" to "Done". Lets say it has two actions for creating two new tasks.
When the task is moved, it's section field is updated from "In Progress" to "Done". This update triggers the workflow. The pre-update version of the task is added to the tail and then the post-update task is added to the tail. The first new task is created and added to the tail, then the same for the second new task.
The template used to define the second new task on the workflow has access to the tail which, at the time of the task's creation, looks like this:
- [0] - Pre-update task
- [1] - Post-update task
- [2] - New Task 1
The second new task can access the new section of the trigger task by using {{ tail[1].section }} in any of it's fields for the new task. The old section would be {{ tail[0].section }}.
Template Values
The following template values are available. As an example, you would access the name of the updated trigger task with {{ tail[1].name }} where "name" could be any of these fields.
| Field | Description |
|---|---|
| name | |
| id | |
| description | |
| assignedTo | The id of the user the task is assigned to. |
| section | |
| startDate | timestamp in epoch milliseconds |
| endDate | timestamp in epoch milliseconds |
| comments | An array of comments, ordered with the newest comment first. A comment has an author and text field. Ex: Access the text for the second to latest comment on the first trigger task with {{ tail[0].comments[1].text }}. |
| tags | An object containing the tags on the task. Ex: Get the value of the Customer tag on the trigger task with {{ tail[0].tags.Customer }}. Or get the phone number of that customer, assuming customer values have a phone field in tag value details, with {{ tail[0].tags.Customer.phone }}. |
Template Functions
Functions can be used to do calculations based on given values in order to get a new value.
| Function | Description |
|---|---|
| dateAdd | Yields a date/time that is a given period from a given date/time. Ex: Get the time 3 weeks after the startDate of the trigger task with {{dateAdd(tail[0].startDate,3w)}}. Unit can be y, m, d, w or h for years, months, days, weeks or hours. |
| userId | Yields a user id for a given user name. Ex: Get Frank's user id with userId(Frank). |
| next | Gives the next value in a provided list after some provided value which is also in the list. Ex: Consider a workflow that is triggered when a task moves from "In Progress" to "Done" with the following template set for the assignedTo field in it's Create Task action. If a task assigned to Frank moves from "In Progress" to "Done", triggering the create, the new task created will be assigned to "Kelly", because she's the next user in the list after Frank. And presuming that new task has the section equal to "In Progress", when it gets moved to "Done", another task assigned to "Ben" will be created because he comes after Kelly in the list. {{next(tail[1].assignedTo, [userId(Ben),userId(Frank),userId(Kelly)])}} |